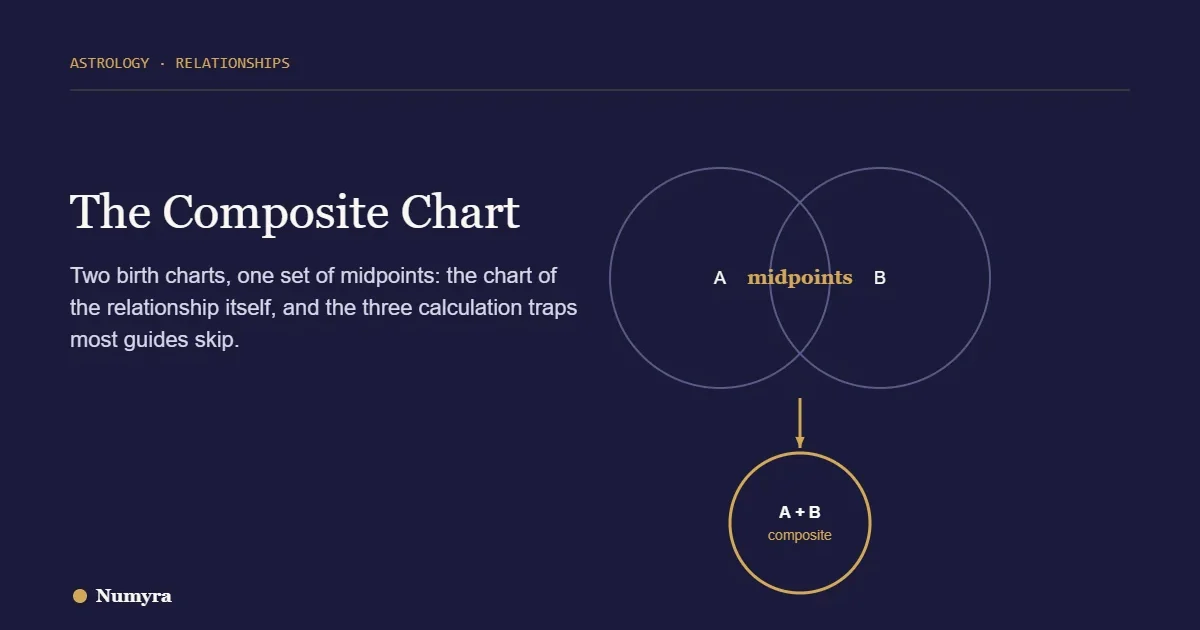
A composite chart is a single astrology chart made from two people’s birth charts by taking the midpoint of each pair of planets: the halfway point between her Sun and his Sun becomes the composite Sun, and so on for every planet and angle. Astrologers read the result as the chart of the relationship itself, a “third entity” with its own character. The arithmetic is simple, but it has three traps that most guides never mention, and getting one wrong can put a planet in the opposite sign.
Key takeaways
- A composite chart takes the midpoint of each pair of placements from two birth charts and reads the result as the chart of the relationship.
- Synastry compares two charts side by side; a composite merges them into one. As astrologer Liz Greene puts it, a composite on its own “will not tell us about compatibility.”
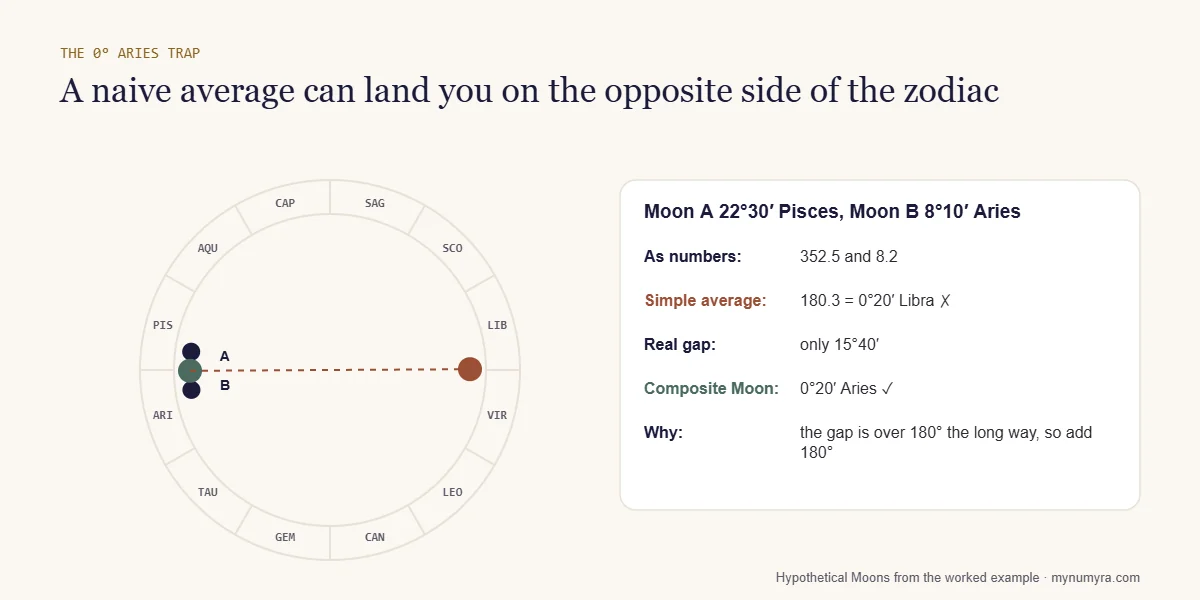
- Always use the nearer midpoint. A naive average of 22°30′ Pisces and 8°10′ Aries gives 0°20′ Libra, exactly opposite the right answer, 0°20′ Aries.
- Mercury and Venus need a fix: their composite positions must sit on the same side of the zodiac as the composite Sun, or the chart shows something impossible.
- A Davison chart is a different method: a real chart cast for the midpoint in time and space between two births. Ronald Davison published it in 1977.
- This is a cultural tradition presented for reflection, not relationship advice.
In this guide
- What a composite chart is
- Composite chart vs. synastry
- How a composite chart is calculated
- A worked example, step by step
- The Ascendant and houses problem
- Composite vs. Davison chart
- Who invented the composite chart?
- How to read a composite chart
- Frequently asked questions
What a composite chart is
Your birth chart records where the Sun, Moon and planets were when you were born. A composite chart takes two birth charts and, for each placement, finds the point exactly halfway between the two people’s positions. If one partner’s Sun is at 10° Gemini and the other’s at 10° Leo, the composite Sun is at 10° Cancer. Do that for every planet, the Ascendant and the Midheaven, and you get a complete chart that belongs to neither person but to the pair.
Astrologers read that chart much as they read a birth chart, but as a portrait of the relationship: what it is for, how it feels from the inside, where it is easy and where it strains. The same couple can also have a composite with friends, business partners or family members; the method does not assume romance.
Composite chart vs. synastry
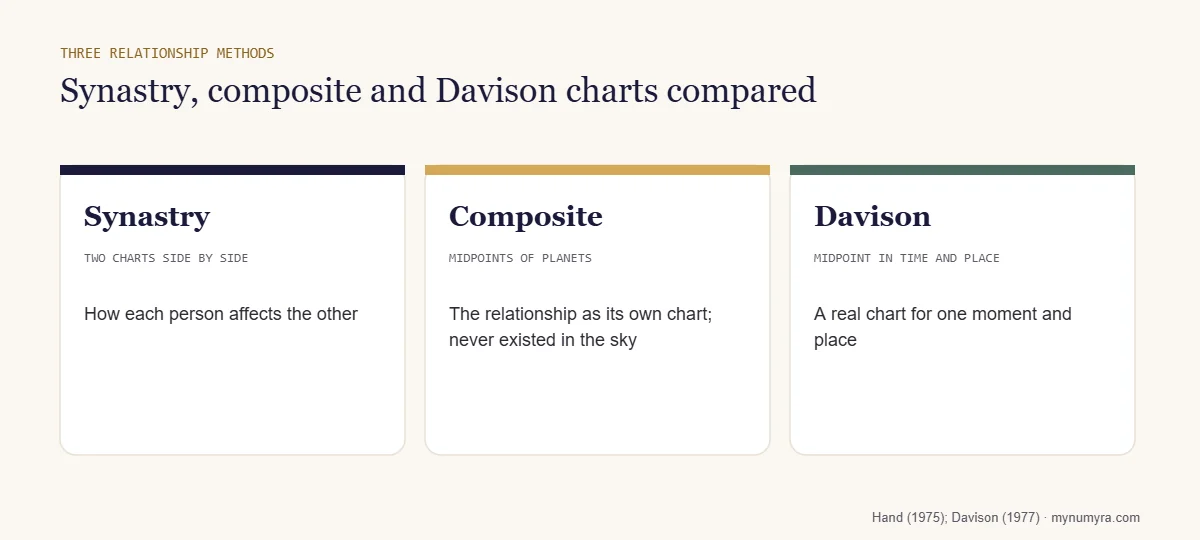
Synastry and composites answer different questions. Synastry overlays two birth charts and looks at how each person’s planets aspect the other’s: whether her Moon trines his Venus, for example. It describes how two people affect each other. A composite merges the two charts into one and describes the relationship as a thing in its own right. Astrologers often summarize the difference as “one plus one equals two” for synastry and “one plus one equals three” for the composite.
Because of that, a composite is not a compatibility score. The psychological astrologer Liz Greene made the point in a seminar given at Regents College, London in 1997:
“A composite in itself will not tell us about compatibility. That is what synastry is for.”
— Liz Greene, “The Composite Chart”, Centre for Psychological Astrology seminar, 27 April 1997 (Astrodienst)
A strained composite can belong to a lasting couple, and a harmonious one to two people who never got on. Most astrologers use both techniques together. Our article on how zodiac compatibility really works explains the simpler sign-based comparison, and our zodiac compatibility calculator does that part for any two signs.
How a composite chart is calculated
The method is a few lines of arithmetic, done the same way for every planet:
- Convert each position to a number from 0 to 360. 0° Aries is 0, 0° Taurus is 30, 0° Gemini is 60, and so on round to 0° Pisces at 330. So 10° Gemini is 70 and 5° Sagittarius is 245.
- Add the two numbers and divide by two. (70 + 245) ÷ 2 = 157.5, which is 7°30′ Virgo.
- Check which midpoint you have. Any two points on a circle have two midpoints, exactly opposite each other. If the two positions are more than 180° apart, the simple average gives the far one, so add 180° to get the nearer one.
- Apply the Mercury and Venus fix, explained below.
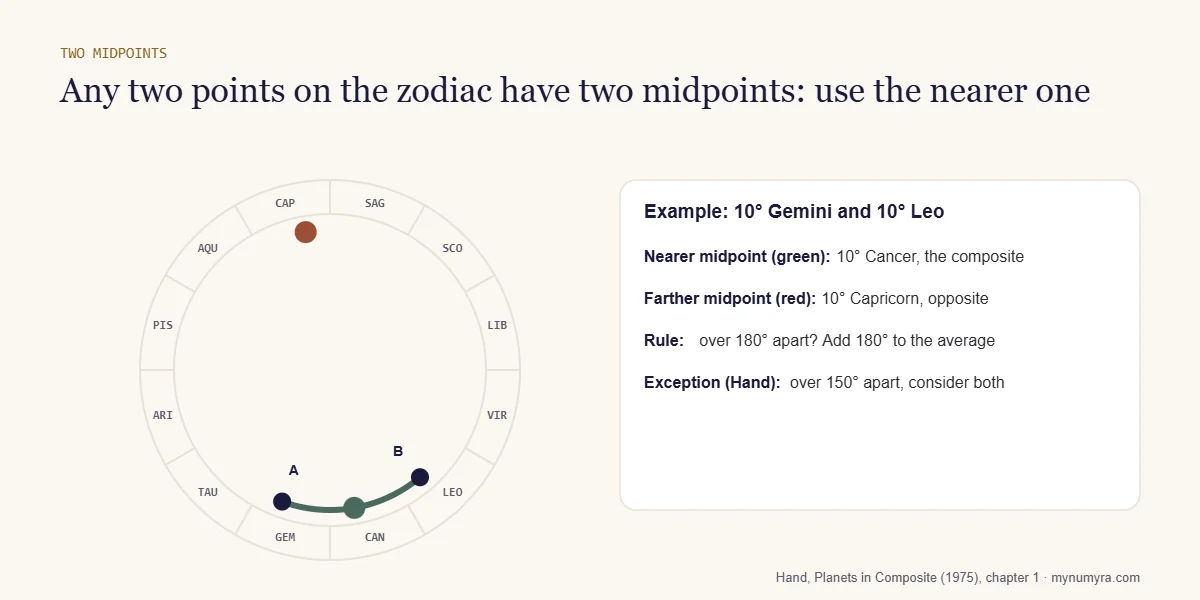
Step 3 is the one that catches people out. Robert Hand’s Planets in Composite (1975), the standard textbook on the technique, calls the midpoint of the shorter arc the “nearer midpoint” and uses it by default, with one exception:
“An exception to the use of the nearer midpoint occurs when the planets being combined are more than 150° apart in their shorter arc.”
— Robert Hand, Planets in Composite: Analyzing Human Relationships (Para Research, 1975), chapter 1
In that case, Hand writes, the two midpoints are nearly equal in strength, and both should be taken into consideration.
The Mercury and Venus fix
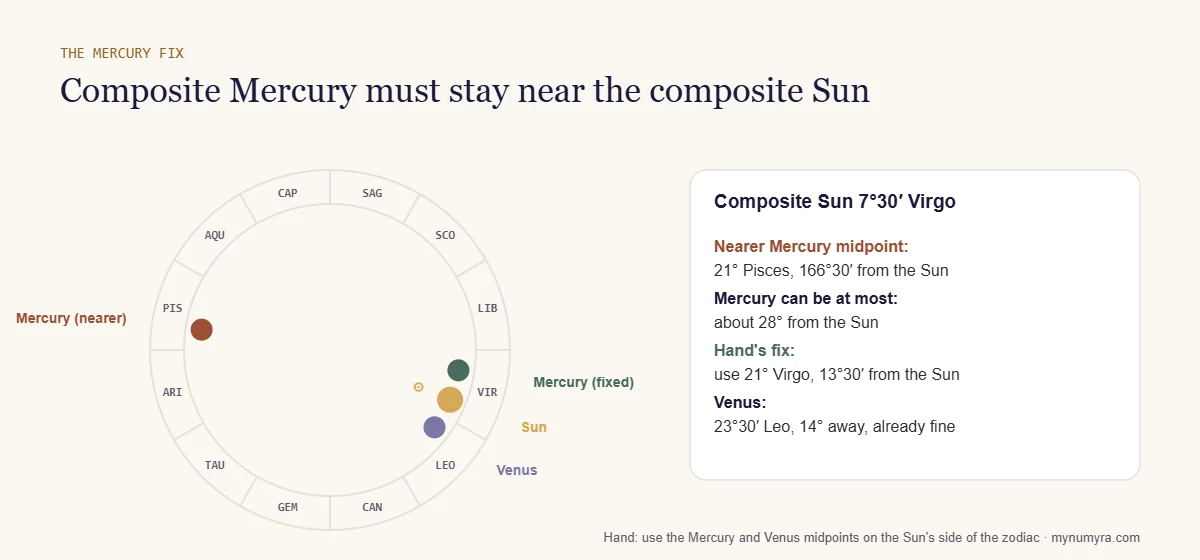
Seen from Earth, Mercury and Venus always stay close to the Sun. Ptolemy already noted in the 2nd century that Mercury “never is farther removed from the sun than one sign in either direction” and Venus never more than two (Tetrabiblos I.17); the modern figures are about 28° for Mercury and about 47° for Venus, which our Venus sign guide checks against NASA data. But when two people’s Suns are nearly opposite, the nearer midpoint of their Mercurys can land on the far side of the zodiac from the composite Sun. Hand’s solution is to use “the Mercury and Venus midpoints that are on the same side of the zodiac as the nearer Sun,” which keeps the composite chart physically sensible.
A worked example, step by step
To show all three traps at once, here are two hypothetical birth charts, invented for this example and not belonging to real people. Every number was checked by script:
| Point | Person A | Person B | Simple average | Gap (shorter arc) | Composite |
|---|---|---|---|---|---|
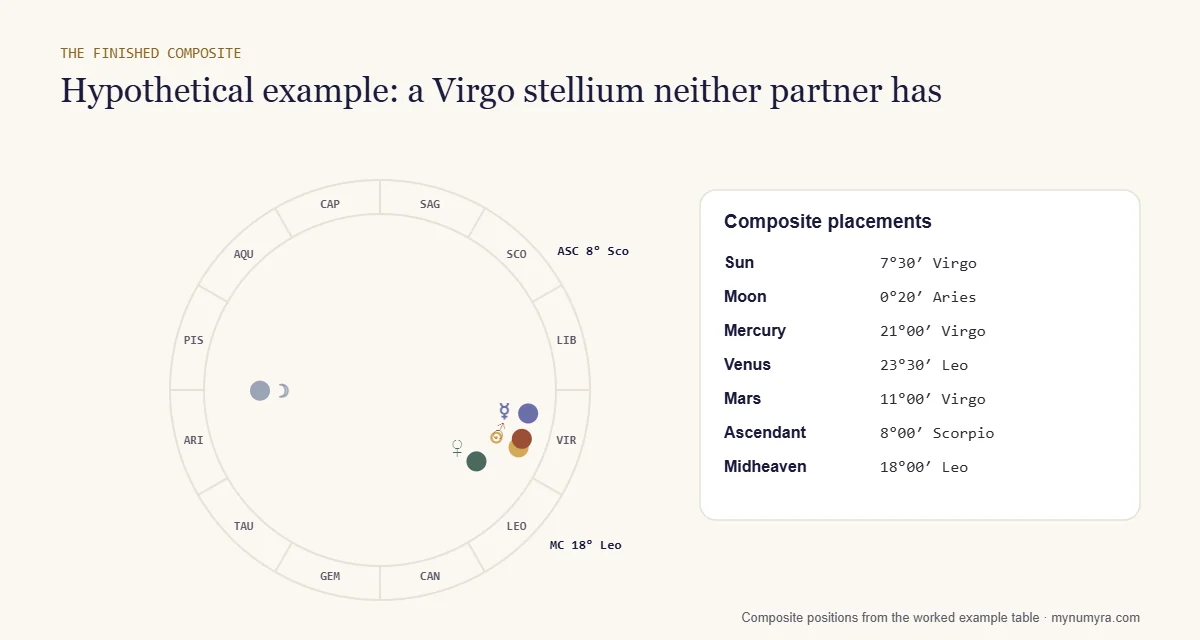
| Sun | 10°00′ Gemini | 5°00′ Sagittarius | 7°30′ Virgo | 175° | 7°30′ Virgo (over 150°: Hand says also consider 7°30′ Pisces) |
| Moon | 22°30′ Pisces | 8°10′ Aries | 0°20′ Libra ✗ | 15°40′ | 0°20′ Aries (the average fell on the far side of 0° Aries) |
| Mercury | 20°00′ Gemini | 22°00′ Sagittarius | 21°00′ Virgo | 178° | 21°00′ Virgo (nearer midpoint 21° Pisces is 166°30′ from the Sun, impossible for Mercury) |
| Venus | 28°00′ Taurus | 19°00′ Scorpio | 23°30′ Leo | 171° | 23°30′ Leo (already on the Sun’s side, 14° away) |
| Mars | 5°00′ Leo | 17°00′ Libra | 11°00′ Virgo | 72° | 11°00′ Virgo (an ordinary case) |
| Ascendant | 14°00′ Virgo | 2°00′ Capricorn | 8°00′ Scorpio | 108° | 8°00′ Scorpio (midpoint method) |
| Midheaven | 11°00′ Gemini | 25°00′ Libra | 18°00′ Leo | 134° | 18°00′ Leo |
The Moon row is the trap to remember. Person A’s Moon is late in Pisces and Person B’s is early in Aries, only 15°40′ apart, yet their numbers are 352.5 and 8.2, so the simple average lands in Libra, half a zodiac away. The right composite Moon sits just past 0° Aries, between the two.
The finished composite has the Sun, Mercury and Mars all in Virgo, a three-planet stellium, which an astrologer would read as a relationship organized around work, service, health or getting things right. Neither person has a single planet in Virgo. That is the point of the technique: the composite can show qualities that belong to the pair and not to either partner.
The Ascendant and houses problem
Planets are easy to combine; the angles are not. The Ascendant and Midheaven depend on exact birth times and places, and averaging them independently can produce a pair that could not occur together at any real place on Earth. Composite calculators handle this in different ways:
- Midpoint method: take the midpoint of both Ascendants and of both Midheavens, as in our example, and accept that the house sizes may look odd.
- Derived method: take only the Midheaven midpoint and calculate an Ascendant from it for a chosen latitude. Hand suggests using the latitude of the residence where the two people live.
Without reliable birth times for both people, skip the angles and houses altogether and read only the planets and their aspects. Our guide to the twelve astrological houses explains what the houses add when you do have them, and our Birth Chart calculator works out each person’s Sun, Moon and Rising sign as a starting point.
Composite vs. Davison chart
The other common relationship chart is the Davison chart, named after the British astrologer Ronald C. Davison. Instead of averaging the planets, it averages the two birth dates, times and places, then casts an ordinary chart for that moment and place. In his 1977 book Synastry, Davison described it as a chart “calculated for the midpoint in space and time between two nativities”, and wrote: “This I christened the ‘Relationship Horoscope.'”
His own worked example used the Duke and Duchess of Windsor:
| Step | Duke of Windsor | Duchess of Windsor | Midpoint |
|---|---|---|---|
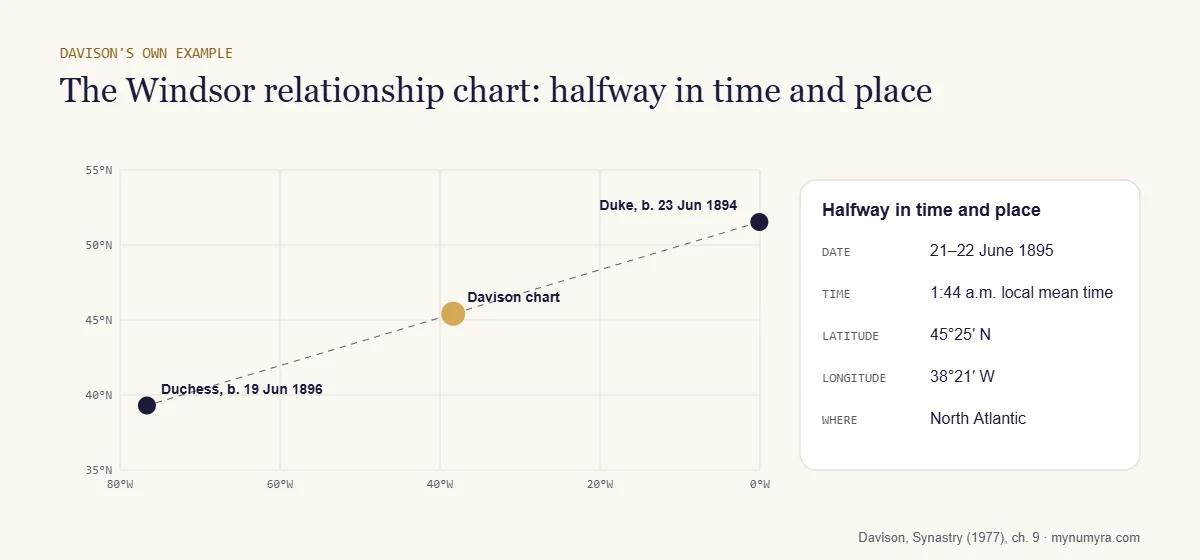
| Birth date | 23 June 1894 | 19 June 1896 | 21–22 June 1895 |
| Latitude | 51°32′ N | 39°18′ N | 45°25′ N |
| Longitude | 0°05′ W | 76°38′ W | 38°21′ W |
Davison cast the chart for 1:44 a.m. local mean time on 22 June 1895 at 45°25′ N, 38°21′ W, a point in the North Atlantic. Because a Davison chart is a real moment, its planets always obey the rules of astronomy, so it needs no Mercury fix and its houses always make sense. A composite, by contrast, never existed in the sky. Davison himself acknowledged the rival method: “a method originating in Germany used mid-points to build up a composite horoscope.” Many astrologers look at both.
Who invented the composite chart?
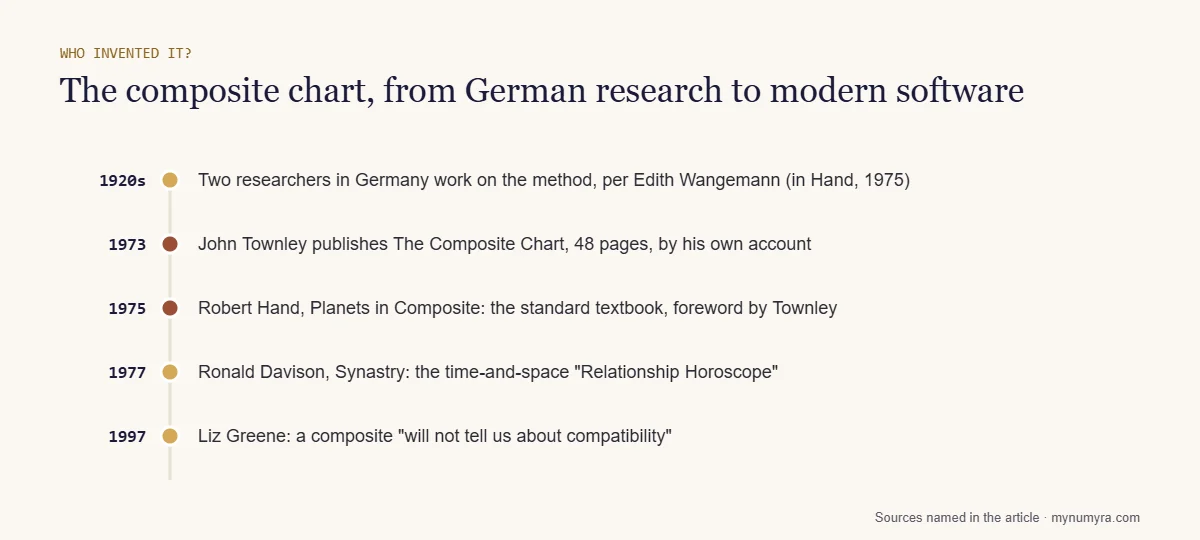
Popular pages often say the American astrologer John Townley invented the composite. Townley himself was more careful. Asked about it on The Astrology Podcast in 2017, he said:
“It was invented back somewhere before. We don’t exactly know when, but it certainly was never in anybody’s major consciousness until I wrote the first book on it.”
— John Townley, The Astrology Podcast, episode 128 (2017), interviewed by Chris Brennan
That book, The Composite Chart, came out in 1973 by his own account, and he described it as “only 48 pages long.” The front matter of Hand’s Planets in Composite (1975), for which Townley wrote the foreword, says “the origin of the composite chart is shrouded in obscurity”. It reports the German astrologer Edith Wangemann’s account that two researchers were working on it in Germany in the 1920s, and adds that the technique probably predates even that. Hand’s book turned the idea into the full system most astrologers still use, and Davison’s 1977 book added the competing time-and-space method. So the fairest answer is: the idea is older and probably German; Townley popularized it in English, and Hand standardized it.
How to read a composite chart
Readings follow the same logic as a birth chart, applied to the relationship:
| Placement | What it is usually read as |
|---|---|
| Composite Sun | The purpose and core identity of the relationship |
| Composite Moon | How the relationship feels day to day; emotional needs it meets |
| Composite Venus | Affection, shared taste and pleasure |
| Composite Mars | Shared drive, desire and how conflict plays out |
| Composite Saturn | Commitments, responsibilities and pressure points |
| Composite Ascendant | How the couple comes across to others (only with reliable birth times) |
| Houses with several planets | The life areas the relationship focuses on, such as home (4th), partnership (7th) or career (10th) |
The usual advice is to start with the Sun and Moon, read much as in a birth chart (see our guide to Sun, Moon and Rising signs), then the aspects between composite planets, then any crowded house. Tight aspects matter more than signs. And because a composite describes the relationship, not either person, the most useful readings ask what the relationship is good for rather than whether it is “good.”
Frequently asked questions
What is the difference between a composite chart and a synastry chart?
Synastry compares two birth charts side by side to see how each person affects the other. A composite merges them into a single chart, built from midpoints, that describes the relationship itself.
What does a composite chart tell you?
It is read as the character and purpose of the relationship: what it is for, how it feels and where it strains. It does not by itself say whether two people are compatible.
How do I calculate my composite chart?
Find the midpoint of each pair of planets: convert both positions to 0–360°, average them, and if they are more than 180° apart add 180° to get the nearer midpoint. Keep composite Mercury and Venus on the same side as the composite Sun.
Is a composite chart more important than synastry?
Neither is more important; they answer different questions. Synastry describes how two people interact; the composite describes the relationship as a unit. Most astrologers read both.
What does a Davison chart tell you?
It is read much like a composite, as the chart of the relationship, but it is cast for the real midpoint in time and place between two births, so it is a chart that actually occurred.
Do I need birth times for a composite chart?
Only for the Ascendant, Midheaven and houses. Without reliable birth times for both people, read the composite planets and their aspects and leave the angles out.
Can a composite chart be done for friends or business partners?
Yes. The method works for any two people; astrologers use it for friendships, families and working partnerships as well as couples.
Sources
- Hand, Robert. Planets in Composite: Analyzing Human Relationships. Para Research, 1975 (first printing August 1975). Foreword by John Townley; chapter 1, “Casting the Chart.” Internet Archive.
- Davison, Ronald C. Synastry: Understanding Human Relations Through Astrology. ASI Publishers, 1977; Aurora Press edition, 1983. Chapter 9, “The Relationship Horoscope.” Internet Archive.
- Brennan, Chris. “Composite Charts with Originator John Townley.” The Astrology Podcast, episode 128 (2017), transcript.
- Greene, Liz. “The Composite Chart.” Centre for Psychological Astrology seminar, 27 April 1997. Astrodienst.
- Ptolemy. Tetrabiblos I.17, trans. F. E. Robbins. Loeb Classical Library, 1940. LacusCurtius.
- Numyra Methodology Desk. The worked example uses two hypothetical charts; all midpoints were calculated and checked by script.