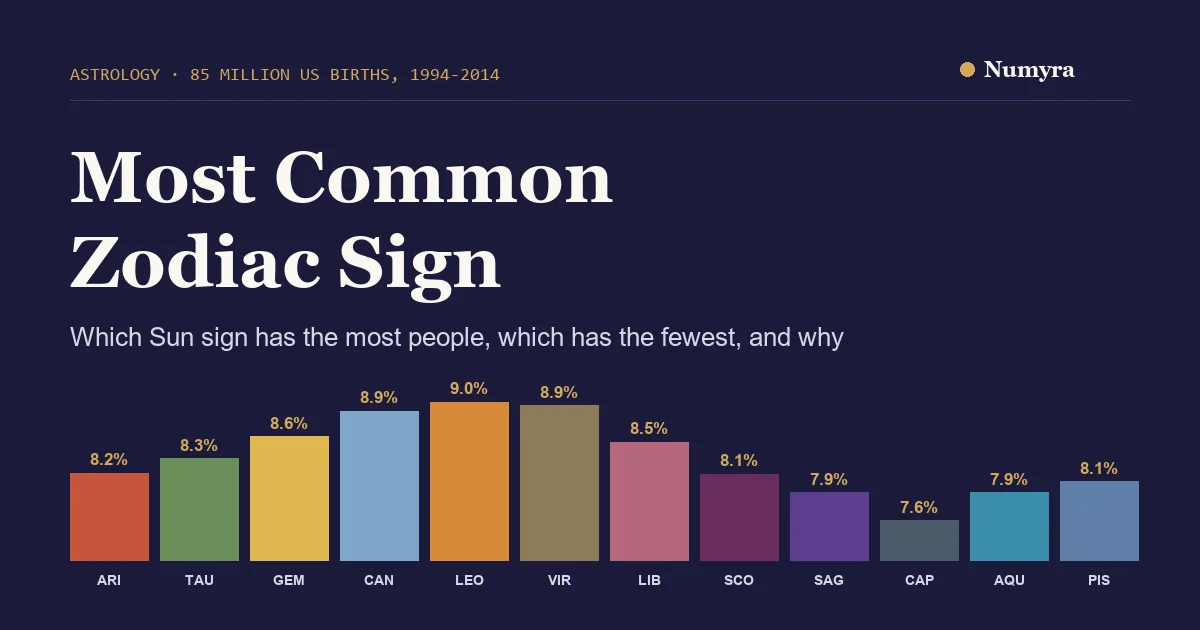
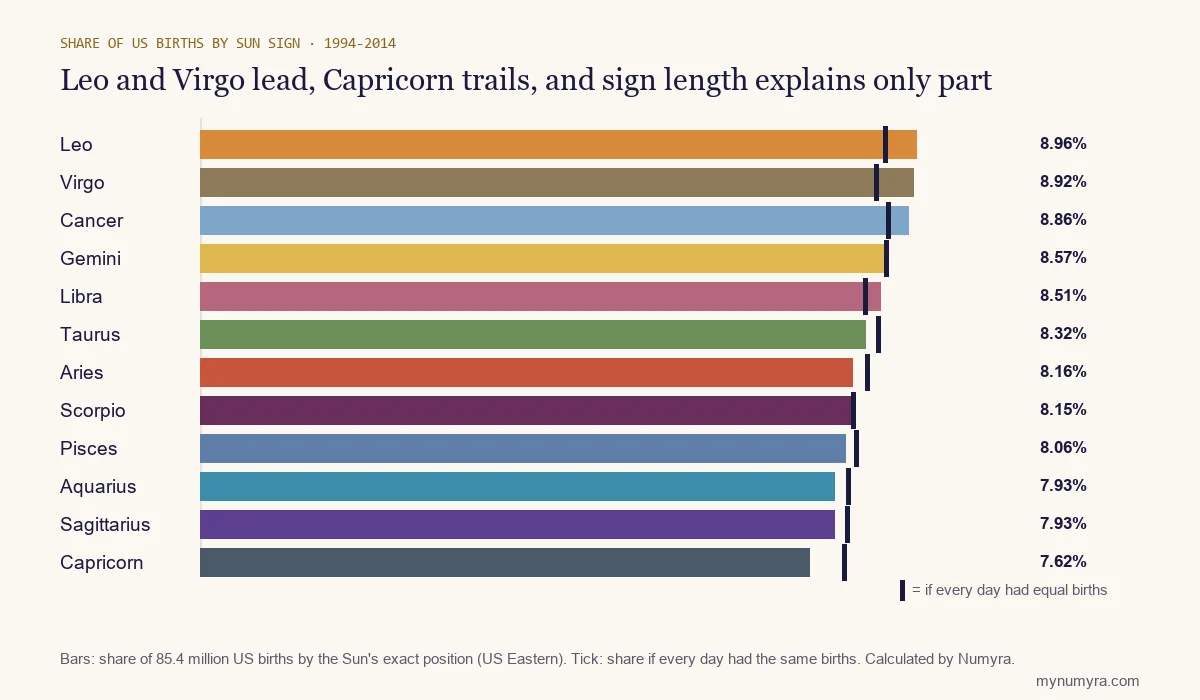
In US birth records from 1994 to 2014, Leo is the most common zodiac sign, with 8.96% of 85.4 million births, narrowly ahead of Virgo (8.92%) and Cancer (8.86%). Capricorn is the least common at 7.62%. The three leaders are close enough that different counting methods crown different winners, and the gap between first and last is only about 1.3 percentage points, so even the most common sign covers fewer than one American in ten.
Key takeaways
- Leo (8.96%), Virgo (8.92%) and Cancer (8.86%) are effectively tied for most common. Leo was ahead of Virgo in 12 of the 21 years we checked and behind in 9, so treat the top spot as a three-way tie.
- Capricorn is the rarest sign at 7.62%, and the lowest in 16 of the 21 years. Aquarius and Sagittarius are tied just above it at 7.93%.
- Sign length explains about 40% of the gap. The rest is when Americans are born: September has 10% more births per day than January, and Virgo season sits on the peak while Capricorn season holds Christmas, New Year and the winter dip.
- Lists that put Cancer first (9.02%) use fixed date ranges, where Cancer gets 32 calendar dates. Using the Sun’s actual position, Cancer averages 31.45 days.
- No Moon sign is meaningfully more common (8.2% to 8.4% each). Rising signs are very uneven, but no birth-hour data exists in the public US files, so we model them rather than count them.
In this guide
- Which Sun sign is the most common
- How we counted 85 million births
- Why some lists say Cancer, Virgo or Scorpio
- Which zodiac sign is the rarest
- Why some signs have more people: sign length and the birth calendar
- Is the lead real? Year by year
- What the day of the week changes
- The most and least common birthdays
- Moon sign frequencies
- Rising sign frequencies
- What a sign’s popularity does and does not tell you
- Frequently asked questions
Which Sun sign is the most common
Your Sun sign is the zodiac sign the Sun was in on your birth date. The table gives the share of US births for each sign, using the Sun’s exact position, next to what each sign’s length alone would predict and how many babies were born per day while the Sun was in it. The first sign column is our headline method; the second is the midday method used in our zodiac sign dates guide, which is why the figures there (Leo 8.97%, Capricorn 7.60%) differ from these by at most 0.02 points. The last column shows what you get if you simply count calendar dates, which is the method behind many popular rankings.
| Sign | Average days in sign | Share if every day were equal | Births per day | Share of births, exact Sun (Eastern) | Share, midday rule | Share, fixed date ranges |
|---|---|---|---|---|---|---|
| Aries | 30.49 | 8.35% | 10,877 | 8.16% | 8.14% | 8.02% |
| Taurus | 30.97 | 8.48% | 10,929 | 8.32% | 8.32% | 8.33% |
| Gemini | 31.33 | 8.58% | 11,123 | 8.57% | 8.59% | 8.48% |
| Cancer | 31.45 | 8.61% | 11,456 | 8.86% | 8.85% | 9.02% |
| Leo | 31.30 | 8.57% | 11,642 | 8.96% | 8.97% | 8.88% |
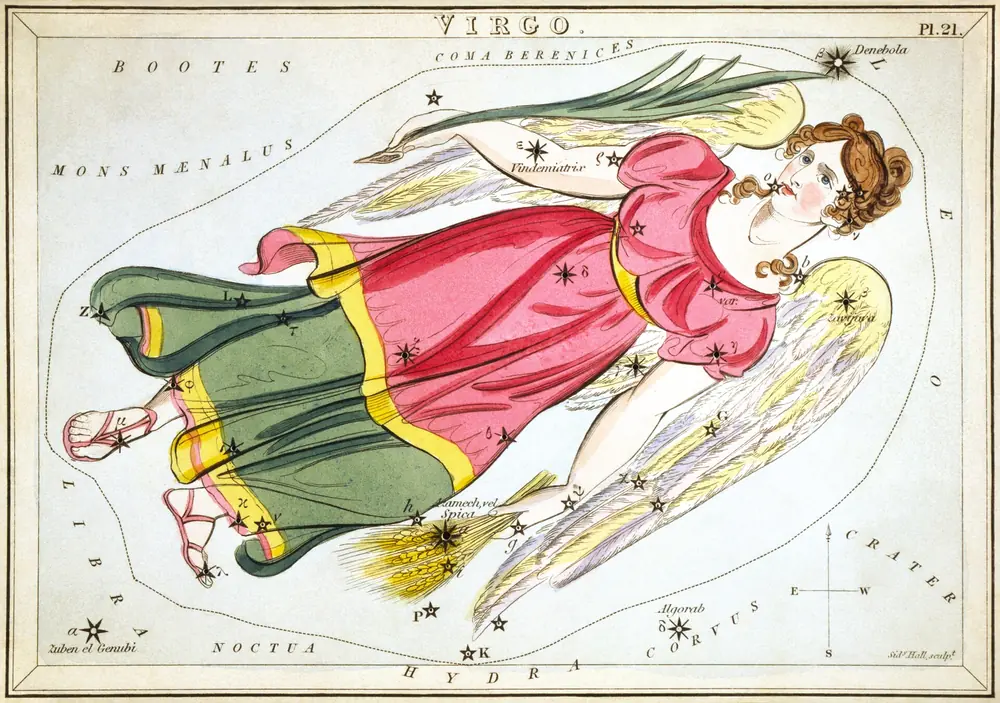
| Virgo | 30.90 | 8.46% | 11,739 | 8.92% | 8.91% | 8.95% |
| Libra | 30.39 | 8.32% | 11,385 | 8.51% | 8.51% | 8.41% |
| Scorpio | 29.86 | 8.17% | 11,095 | 8.15% | 8.16% | 8.18% |
| Sagittarius | 29.55 | 8.09% | 10,914 | 7.93% | 7.95% | 8.06% |
| Capricorn | 29.44 | 8.06% | 10,522 | 7.62% | 7.60% | 7.50% |
| Aquarius | 29.59 | 8.10% | 10,903 | 7.93% | 7.94% | 8.05% |
| Pisces | 29.97 | 8.21% | 10,937 | 8.06% | 8.05% | 8.14% |
Leo takes first place by 0.04 points over Virgo, a margin of about 35,000 births in 85 million. Leo accounts for 7.65 million of the births, Virgo 7.62 million and Cancer 7.57 million. Capricorn has 6.51 million, about 1.15 million fewer than Leo.
How we counted 85 million births
The birth counts are the daily totals published by the CDC’s National Center for Health Statistics for 1994 to 2003 and the Social Security Administration for 2004 to 2014, as compiled by FiveThirtyEight. That is 7,670 days and 85,386,227 births. The files describe themselves plainly:
“contains U.S. births data for the years 1994 to 2003, as provided by the Centers for Disease Control and Prevention’s National Center for Health Statistics.”
FiveThirtyEight, US births data README
The files give a date and a count, not a time of day. We therefore placed the Sun at every half hour of every US Eastern calendar day with the Swiss Ephemeris and split each day’s births across the signs in proportion to the time the Sun spent in each, which assumes births are spread evenly through the day. The midday rule uses noon US Eastern standard time. Redoing the exact method in Pacific time changed no sign by more than 0.003 points. Only 3.3% of births fall on a day when the Sun changes sign, and the simpler midday rule gives a different sign to about 0.8% of births. Our data are US only, cover births from 1994 to 2014 (people now aged roughly 12 to 32), and say nothing about other countries or older generations.
Why some lists say Cancer, Virgo or Scorpio
Searches for the most common sign return different winners, and the differences come from method and data rather than from who is right.
| Method and data | Most common | Least common |
|---|---|---|
| Sun’s exact position, US births 1994 to 2014 (this page) | Leo, 8.96% | Capricorn, 7.62% |
| Midday rule, same births (zodiac sign dates guide) | Leo, 8.97% | Capricorn, 7.60% |
| Fixed date ranges (Cancer June 21 to July 22), same births | Cancer, 9.02% | Capricorn, 7.50% |
| Fixed ranges, as reported by YourTango (1994 to 2014 data) | Cancer, 9.01% | Not given |
| Voter file and Census survey, as reported by The Washington Post (December 2025) | Virgo, with Cancer next | Capricorn, Sagittarius, Scorpio |
| A list with no source named (Astrofame) | Scorpio, 9.6% | Aquarius, 6.3% |
The Cancer result reproduces exactly. Run the same CDC and Social Security files through fixed date ranges and Cancer comes out at 9.02%, Virgo 8.95% and Leo 8.88%, matching the figures YourTango published (9.01%, 8.95%, 8.88%). The reason is arithmetic. In a fixed-date list Cancer is June 21 to July 22, which is 32 calendar dates, and Capricorn is December 22 to January 19, which is 29. The Sun really takes 31.45 days to cross Cancer on average and 29.44 days to cross Capricorn, so the fixed list gives Cancer an extra half day it does not have, which is worth about 0.15 points. Our zodiac sign dates guide explains why the real boundaries move from year to year.
The Washington Post used a different population: adult birthdays from voter files and the Census Bureau’s survey, with astrology.com’s date ranges. Its finding that Virgo leads fits ours, because the signs it names as most common sit across the three busiest birth months. The Post adds a useful caution:
“even the most common sign accounts for fewer than 1 in 10 Americans.”
Andrew Van Dam, The Washington Post, via Yahoo, December 8, 2025
The unsourced list is the outlier. Its Scorpio at 9.6% is 1.4 points above our 8.15% and its Aquarius at 6.3% is 1.6 points below ours, and it names no dataset, so it cannot be reproduced. It does not match our US counts under any of the methods above.
Which zodiac sign is the rarest
Capricorn is the rarest sign in the US data under every method we tried: 7.62% by the Sun’s exact position, 7.60% by the midday rule and 7.50% by fixed dates. It had the lowest share in 16 of the 21 individual years. It is the shortest sign (29.44 days) and its days include the lowest-birth dates of the year, Christmas Day and New Year’s Day. Aquarius and Sagittarius are tied for second rarest at 7.93% each.
Some websites name Aquarius the rarest sign because February is the shortest and a low-birth month. In our counts Aquarius is only third from last, about 0.3 points above Capricorn, because January 20 to 31 is a stronger birth period than late December. Pisces comes next at 8.06%, then Scorpio (8.15%) and Aries (8.16%).
Why some signs have more people: sign length and the birth calendar
Two effects produce the ranking. The first is sign length. The Sun does not move at a steady pace through the zodiac, because Earth’s orbit is slightly oval; it takes 31.45 days to cross Cancer and 29.44 to cross Capricorn. If every day of the year had the same number of births, Cancer would hold 8.61% of people and Capricorn 8.06%, a spread of 0.55 points, which is about 40% of the real 1.34-point spread from Capricorn to Leo.
The second effect is the birth calendar. The average US day had 11,132 births, but the busiest months ran far above that. September had 11,764 births per day and January 10,678, a 10% difference.
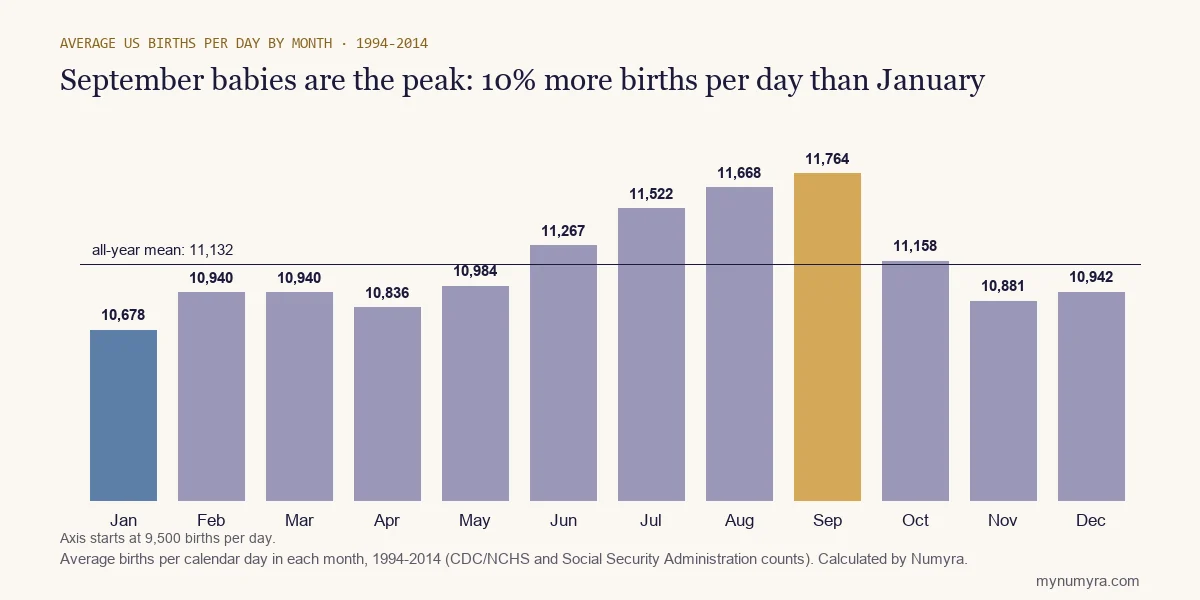
Cancer is the longest sign, yet Virgo has the busiest days: while the Sun is in Virgo, 11,739 babies were born per day, 5.4% above average, against 11,456 in Cancer and 11,642 in Leo. Virgo is a shorter sign than Cancer by half a day but its days are about 2.5% busier. Capricorn is hit twice, with the fewest days and the quietest ones at 10,522 per day, 5.5% below average. A sign’s share of people is its length multiplied by its birth rate: Virgo gets +0.46 points from busy days and Capricorn loses 0.44 points to quiet ones. Our Virgo, Cancer and Capricorn profiles describe the traditional meanings; none of this affects them.
Is the lead real? Year by year
These are counts of every recorded birth, not a sample, so there is no margin of error in the usual sense. The question is whether the ordering is stable. For the top three, it is not. Counting each year separately with the midday rule, Leo had the largest share in 11 years, Virgo in 6 and Cancer in 4. Leo minus Virgo ranged from -0.46 to +0.85 points, averaging +0.07.
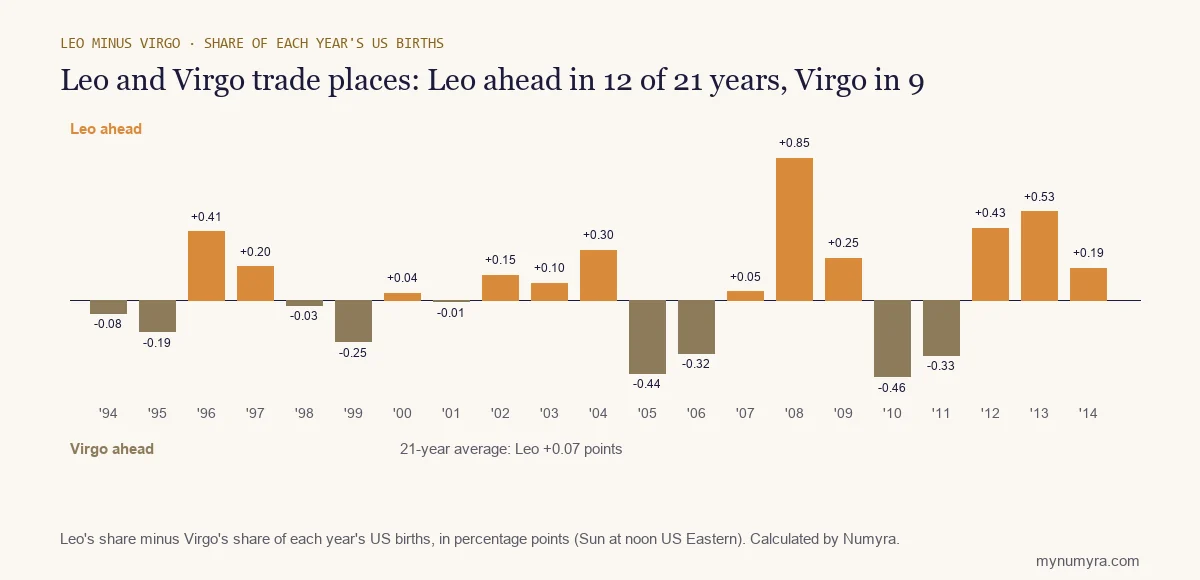
The two halves of the data agree on the broad picture. In 1994 to 2003 Leo had 8.94%, Virgo 8.91% and Cancer 8.88%; in 2004 to 2014 Leo had 9.00%, Virgo 8.91% and Cancer 8.83%. Capricorn was 7.60% in both. So the real conclusion is that Leo, Virgo and Cancer are all about 8.9% and Capricorn is about 1.3 points lower; whoever is first depends on the years and the method. For more on how the Sun’s entry time changes birthdays, see our guide to zodiac sign dates.
What the day of the week changes
Births in the US are strongly tied to the working week. In our data a weekday (Monday to Friday) averages 12,345 births and a weekend day 8,102, which is 52% more on weekdays. Tuesday is the busiest day (12,788) and Sunday the quietest (7,610). The Post’s analysis of CDC data found the same pattern and gave the reason:
“American birth rates jump by about 50 percent on weekdays according to our analysis of recent data from the Centers for Disease Control and Prevention.”
Andrew Van Dam, The Washington Post, via Yahoo, December 8, 2025
The weekday effect changes individual birthdays a lot, as the next section shows, but it does not change the sign ranking. Every sign spans four or more weeks, so each gets a similar mix of weekdays and weekends. When we divided each day’s births by the average for its weekday in that year and recounted, no sign moved by more than 0.02 points, and Leo, Virgo and Cancer stayed on top.
The most and least common birthdays
Birth dates vary far more than signs do. We averaged each calendar date over the 21 years, so 29 February (only five leap years in the data) is averaged over those five. Nine of the ten most common birthdays fall in September; the ten least common are dominated by Christmas, New Year and other holidays, when fewer deliveries are likely to be scheduled.
| Rank | Most common birthdays | Average births on that date | Usual Sun sign | Least common birthdays | Average births on that date | Usual Sun sign |
|---|---|---|---|---|---|---|
| 1 | Sep 9 | 12,301 | Virgo | Dec 25 | 6,574 | Capricorn |
| 2 | Sep 19 | 12,229 | Virgo | Jan 1 | 7,792 | Capricorn |
| 3 | Sep 12 | 12,224 | Virgo | Dec 24 | 8,069 | Capricorn |
| 4 | Sep 17 | 12,148 | Virgo | Jul 4 | 8,796 | Cancer |
| 5 | Sep 10 | 12,143 | Virgo | Jan 2 | 9,307 | Capricorn |
| 6 | Jul 7 | 12,108 | Cancer | Dec 26 | 9,543 | Capricorn |
| 7 | Sep 20 | 12,107 | Virgo | Nov 27 | 9,718 | Sagittarius |
| 8 | Sep 15 | 12,087 | Virgo | Nov 23 | 9,883 | Sagittarius |
| 9 | Sep 16 | 12,072 | Virgo | Nov 25 | 9,954 | Sagittarius |
| 10 | Sep 18 | 12,055 | Virgo | Oct 31 | 9,978 | Scorpio |
The busiest date, September 9, averaged 12,301 births a year, and the rarest, Christmas Day, 6,574, 47% fewer. The average date had 11,132. Five of the ten rarest dates fall in Capricorn season, which is a large part of why that sign trails. The Post’s longer series of voter-file birthdays puts its peak in the second half of September, while ours, which cover only births from 1994 to 2014, peak earlier in the month; the month agrees even though individual dates shift between periods. The date-based reading is covered in our guide to the birthday number.
Moon sign frequencies
Your Moon sign needs your birth time as well as the date, because the Moon changes sign about every 2.3 days. The US files have no times, so we assigned each birth date the Moon’s sign at midday Universal Time (so not strictly each person’s Moon sign), and as a second method split each day’s births across signs by the time the Moon spent in each, using US Eastern days. The Moon’s cycle is unrelated to the season and weekday, so no sign should be favoured.
| Moon sign | Share of births, Moon at midday UT | Share of births, time-split | Share of days, no birth weighting |
|---|---|---|---|
| Aries | 8.33% | 8.39% | 8.33% |
| Taurus | 8.43% | 8.43% | 8.41% |
| Gemini | 8.43% | 8.42% | 8.44% |
| Cancer | 8.42% | 8.41% | 8.44% |
| Leo | 8.43% | 8.39% | 8.42% |
| Virgo | 8.29% | 8.35% | 8.32% |
| Libra | 8.38% | 8.31% | 8.34% |
| Scorpio | 8.27% | 8.29% | 8.25% |
| Sagittarius | 8.24% | 8.23% | 8.25% |
| Capricorn | 8.26% | 8.23% | 8.25% |
| Aquarius | 8.26% | 8.26% | 8.27% |
| Pisces | 8.26% | 8.29% | 8.28% |
Every Moon sign holds between 8.2% and 8.4% of births, against an even 8.33%. The pattern is in the days, not the babies: weighting by births barely changes the third column, so the small differences are the result of which 7,670 days the 21 years happened to contain rather than anything about birth rates. No Moon sign is more common in any useful sense. See the Moon signs page for what each sign means, and the birth chart calculator to find yours.
Rising sign frequencies
Rising signs are the opposite case. The sign on the eastern horizon changes about every two hours, but signs do not rise at an equal speed: near the equator they take similar times, and at higher latitudes the signs from Cancer to Sagittarius rise slowly and Aries and Pisces rise very fast. The public birth files have no birth hours, so we cannot count real rising signs. What we can calculate is the share of a day that each sign is rising, which is what the distribution would be if births were spread evenly over the clock.
| Rising sign | Miami (25.8 N) | New York (40.7 N) | Seattle (47.6 N) | Anchorage (61.2 N) |
|---|---|---|---|---|
| Aries | 6.2% | 5.0% | 4.2% | 1.7% |
| Taurus | 7.0% | 6.0% | 5.3% | 2.7% |
| Gemini | 8.4% | 8.0% | 7.6% | 6.1% |
| Cancer | 9.5% | 9.9% | 10.2% | 11.8% |
| Leo | 9.6% | 10.6% | 11.3% | 13.9% |
| Virgo | 9.3% | 10.5% | 11.3% | 13.8% |
| Libra | 9.3% | 10.5% | 11.3% | 13.8% |
| Scorpio | 9.6% | 10.6% | 11.3% | 13.9% |
| Sagittarius | 9.5% | 9.9% | 10.2% | 11.8% |
| Capricorn | 8.4% | 8.0% | 7.6% | 6.1% |
| Aquarius | 7.0% | 6.0% | 5.3% | 2.7% |
| Pisces | 6.2% | 5.0% | 4.2% | 1.7% |
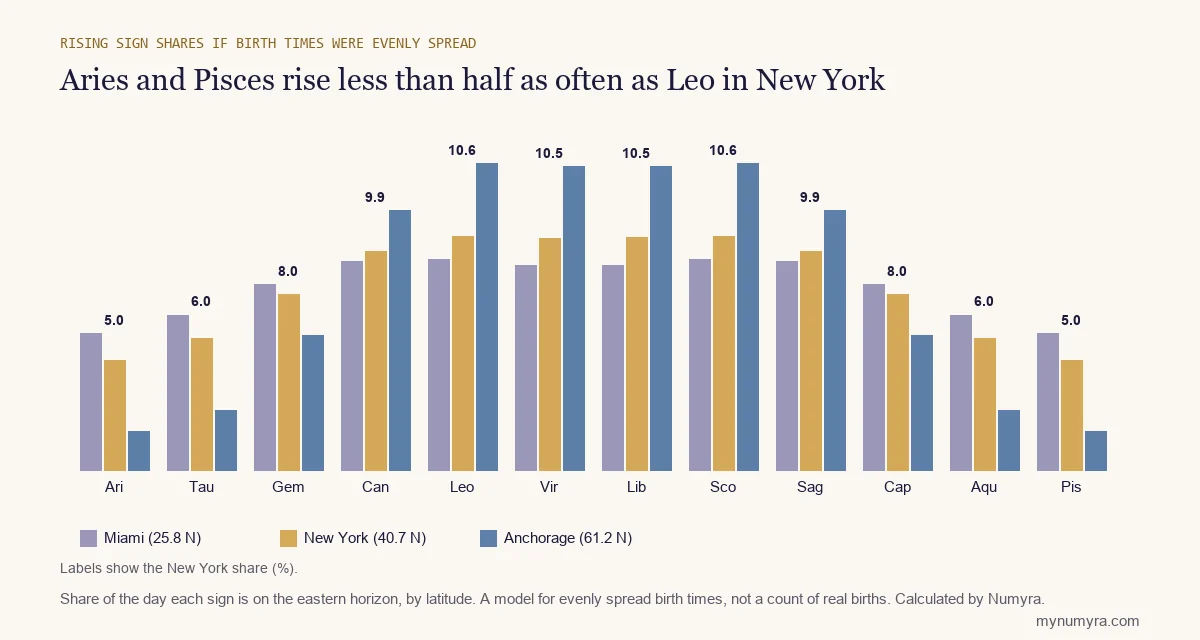
In New York, Leo and Scorpio (10.6% each) would be the most common rising signs and Aries and Pisces (5.0% each) the rarest, less than half as often. The effect grows with latitude, so that in Anchorage Aries or Pisces rise only 1.7% of the time. Real births are not evenly spread over the clock, since scheduled deliveries cluster in working hours, so treat the table as a baseline, not a count. Read more on the rising signs page; the Mars sign and Mercury sign guides report the equivalent shares for those planets.
What a sign’s popularity does and does not tell you
A sign’s frequency is a fact about birth calendars and the length of the Sun’s visit, not about character. Astrology reads each sign through tradition and symbolism, and the tradition makes no claim that common signs are better or rarer ones more special. This page is educational and data-led, a count of when Americans were born. For what each sign is traditionally taken to mean, start at the zodiac signs hub.
Frequently asked questions
What is the most common zodiac sign?
In US births from 1994 to 2014, Leo, with 8.96% of 85.4 million births. Virgo (8.92%) and Cancer (8.86%) are statistically close behind, and Leo led Virgo in only 12 of the 21 years. Other studies using different data or fixed date ranges name Virgo or Cancer.
What is the rarest zodiac sign?
Capricorn, at 7.62% of US births from 1994 to 2014. It is the shortest sign and includes Christmas and New Year, the two days with the fewest births. Aquarius and Sagittarius follow at 7.93% each.
Is Cancer or Virgo the most common sign?
It depends on the method. Fixed date ranges give Cancer 9.02% and Virgo 8.95%, because Cancer gets 32 calendar dates. Using the Sun’s actual position, Cancer averages 31.45 days and falls to 8.86%, behind Leo (8.96%) and Virgo (8.92%).
Which birthday is the most common?
September 9 in our 1994 to 2014 data, with 12,301 births a year on average, and nine of the top ten dates are in September. The least common is December 25 with 6,574, followed by January 1 and December 24.
What is the most common Moon sign?
None is meaningfully more common. By the Moon’s position at midday Universal Time on each birth date, every sign holds between 8.2% and 8.4% of US births, and the differences are not related to birth rates.
What is the rarest rising sign?
Aries and Pisces, if birth times are spread evenly through the day. In New York each rises about 5.0% of the time against 10.6% for Leo and Scorpio, and the gap is wider farther north. Real birth hours are not in the public US files, so this is a model, not a count.
Does this apply outside the United States?
We cannot say. Our data are US births only, and the pattern depends on each country’s seasonal birth pattern, holidays and hospital scheduling. The Post’s analysis found the US ranking itself shifts by region, with Cancer more common in the north and Virgo or Libra in the south.
Does the most common sign mean anything about personality?
No. It reflects when babies are born and how long the Sun stays in each sign. What a sign is said to mean is a tradition, offered for reflection and entertainment, and it has not been shown to predict personality or events.
Sources
- FiveThirtyEight. US births data, 1994 to 2014, from the CDC National Center for Health Statistics (1994 to 2003) and the Social Security Administration (2000 to 2014). Every share, birth count and birthday average on this page.
- CDC National Center for Health Statistics. Births data. The official source of US birth records.
- Andrew Van Dam, The Washington Post (via Yahoo), December 8, 2025. The most common Zodiac signs (and birthdays). Voter-file and Census analysis, and the weekday birth pattern.
- YourTango. What Is The Most Common Zodiac Sign? Cancer 9.01%, Virgo 8.95% and Leo 8.88%, which our fixed-date count reproduces.
- Astrofame. The most common zodiac sign to the rarest. An unsourced list (Scorpio 9.6%, Aquarius 6.3%) cited for comparison.
- Astrodienst. Swiss Ephemeris. The Sun’s and Moon’s positions and the Ascendant (calculations by the Numyra Methodology Desk, US Eastern time with historical daylight saving rules).